The Mason Dixon Meteor
This is the official page of the
Mason Dixon Meteor
I have worked for thousands of hours and walked thousands of miles and spent thousands of dollars looking for the meteorites that fell in Lancaster Pennsylvania on July 6th, 2009. I have learned, researched, chased, hunted, refined, reworked, prayed, meditated and obsessed over the Mason Dixon Meteor for more than two years. It has been a rewarding and enlightening experience despite not finding any actual meteorites. Over this time I have compiled a wealth of information on this event and have written a lot of blog posts about different aspects of this fall. I have learned a lot about meteors and meteorites and the physics behind trajectory solutions and dark flight models. I have created this page in an effort to consolidate all of the useful information about this meteor event and meteorite search.
Background
On July 6th, 2009 at 1:04:45 AM EST a meteor entered the Earth’s atmosphere directly over the city of Baltimore and headed on a northeast trajectory terminating its illuminated flight 20km over Lancaster County Pennsylvania. Despite its early morning arrival time the meteor was witnessed by thousands not because of its immense size and brightness in the sky, and not because it turned night into day for 3 seconds — this meteor was not just seen, it was heard and it was felt. I was one of the thousands of people whose home shook after the meteor flew through the sky. A day after the fall this boom reverberated around the globe in the meteorite hunting community as an alarm bell signaling that fresh meteorites were now sitting on the ground somewhere in south central Pennsylvania. Like warriors rallying to the battle cry the meteorite hunters of the world temporarily turned their focus onto the land and people north and south of the Mason Dixon line for one reason — to find meteorites.
Press Stories – News & Videos
Here are links to the stories, alerts and blogs about the meteor fall:
Maryland Weather – A Mason Dixon Meteor – Frank Roylance, a writer for the Baltimore Sun was the first to break the story on his weather blog. Frank is also responsible for coining the name. Frank’s blog post became the central hub for witnesses to report what they saw, heard and felt in the days that followed the fall. Almost 100 witnesses commented on his blog post.
Fireball May Have Been Caught On Security Camera – WGAL York County News
July 6th Pennslyvannia Fireball Meteor – Tucson Citizen
Meteor Shoots Across Region, Is Caught on Video – Lancaster New Era
Meteor’s Fall Triggers Cosmic Treasure Hunt – Baltimore Sun Front Page
U.S. Meteorite Hunters Go Bicoastal – Sky and Telescope Magazine
Here are some news videos about the story:
Meteor Videos
Here are all of the videos that were recorded of the meteor.
York Water Pumping Station
The first video to surface from the event captured the final stage of the meteor’s flight. These are the last 2-3 seconds of the event that followed the terminal burst.
Due to the distortion caused by the fish-eye lens of this camera, no useful azimuth or elevation measurements could be taken from the video, initially. It was not until October of 2009 when new video of the moon rising over two nights from the camera’s field of view that the video could be analyzed and useful measurements made.
Alison Kruse
This video was taken from Pittsburgh PA almost 200 miles away from the location of the event. The video captured the entry of the meteor into the earth’s atmosphere.
York Water Flag Pole
A second York Water camera captured light and shadows from the meteor’s terminal burst. The light caused a shadow from a flag pole to be cast on the ground.
While no elevation coordinates were ever determined from the video, rough azimuth values were gleaned using satellite maps and an analysis of the shadows.
Safe Harbor Dam
While this video did not provide useful azimuth or elevation measurements, it did established the exact time of the meteor event because the camera system was time-sync’d due to federal regulations.
Lancaster Security
Taken from a security camera in Lancaster city, this video captured the reflection of the bolide ontop of the hood of a armored car. No useful information was ever gleaned from this video.
World Record Telescopic Picture of Super Bolide
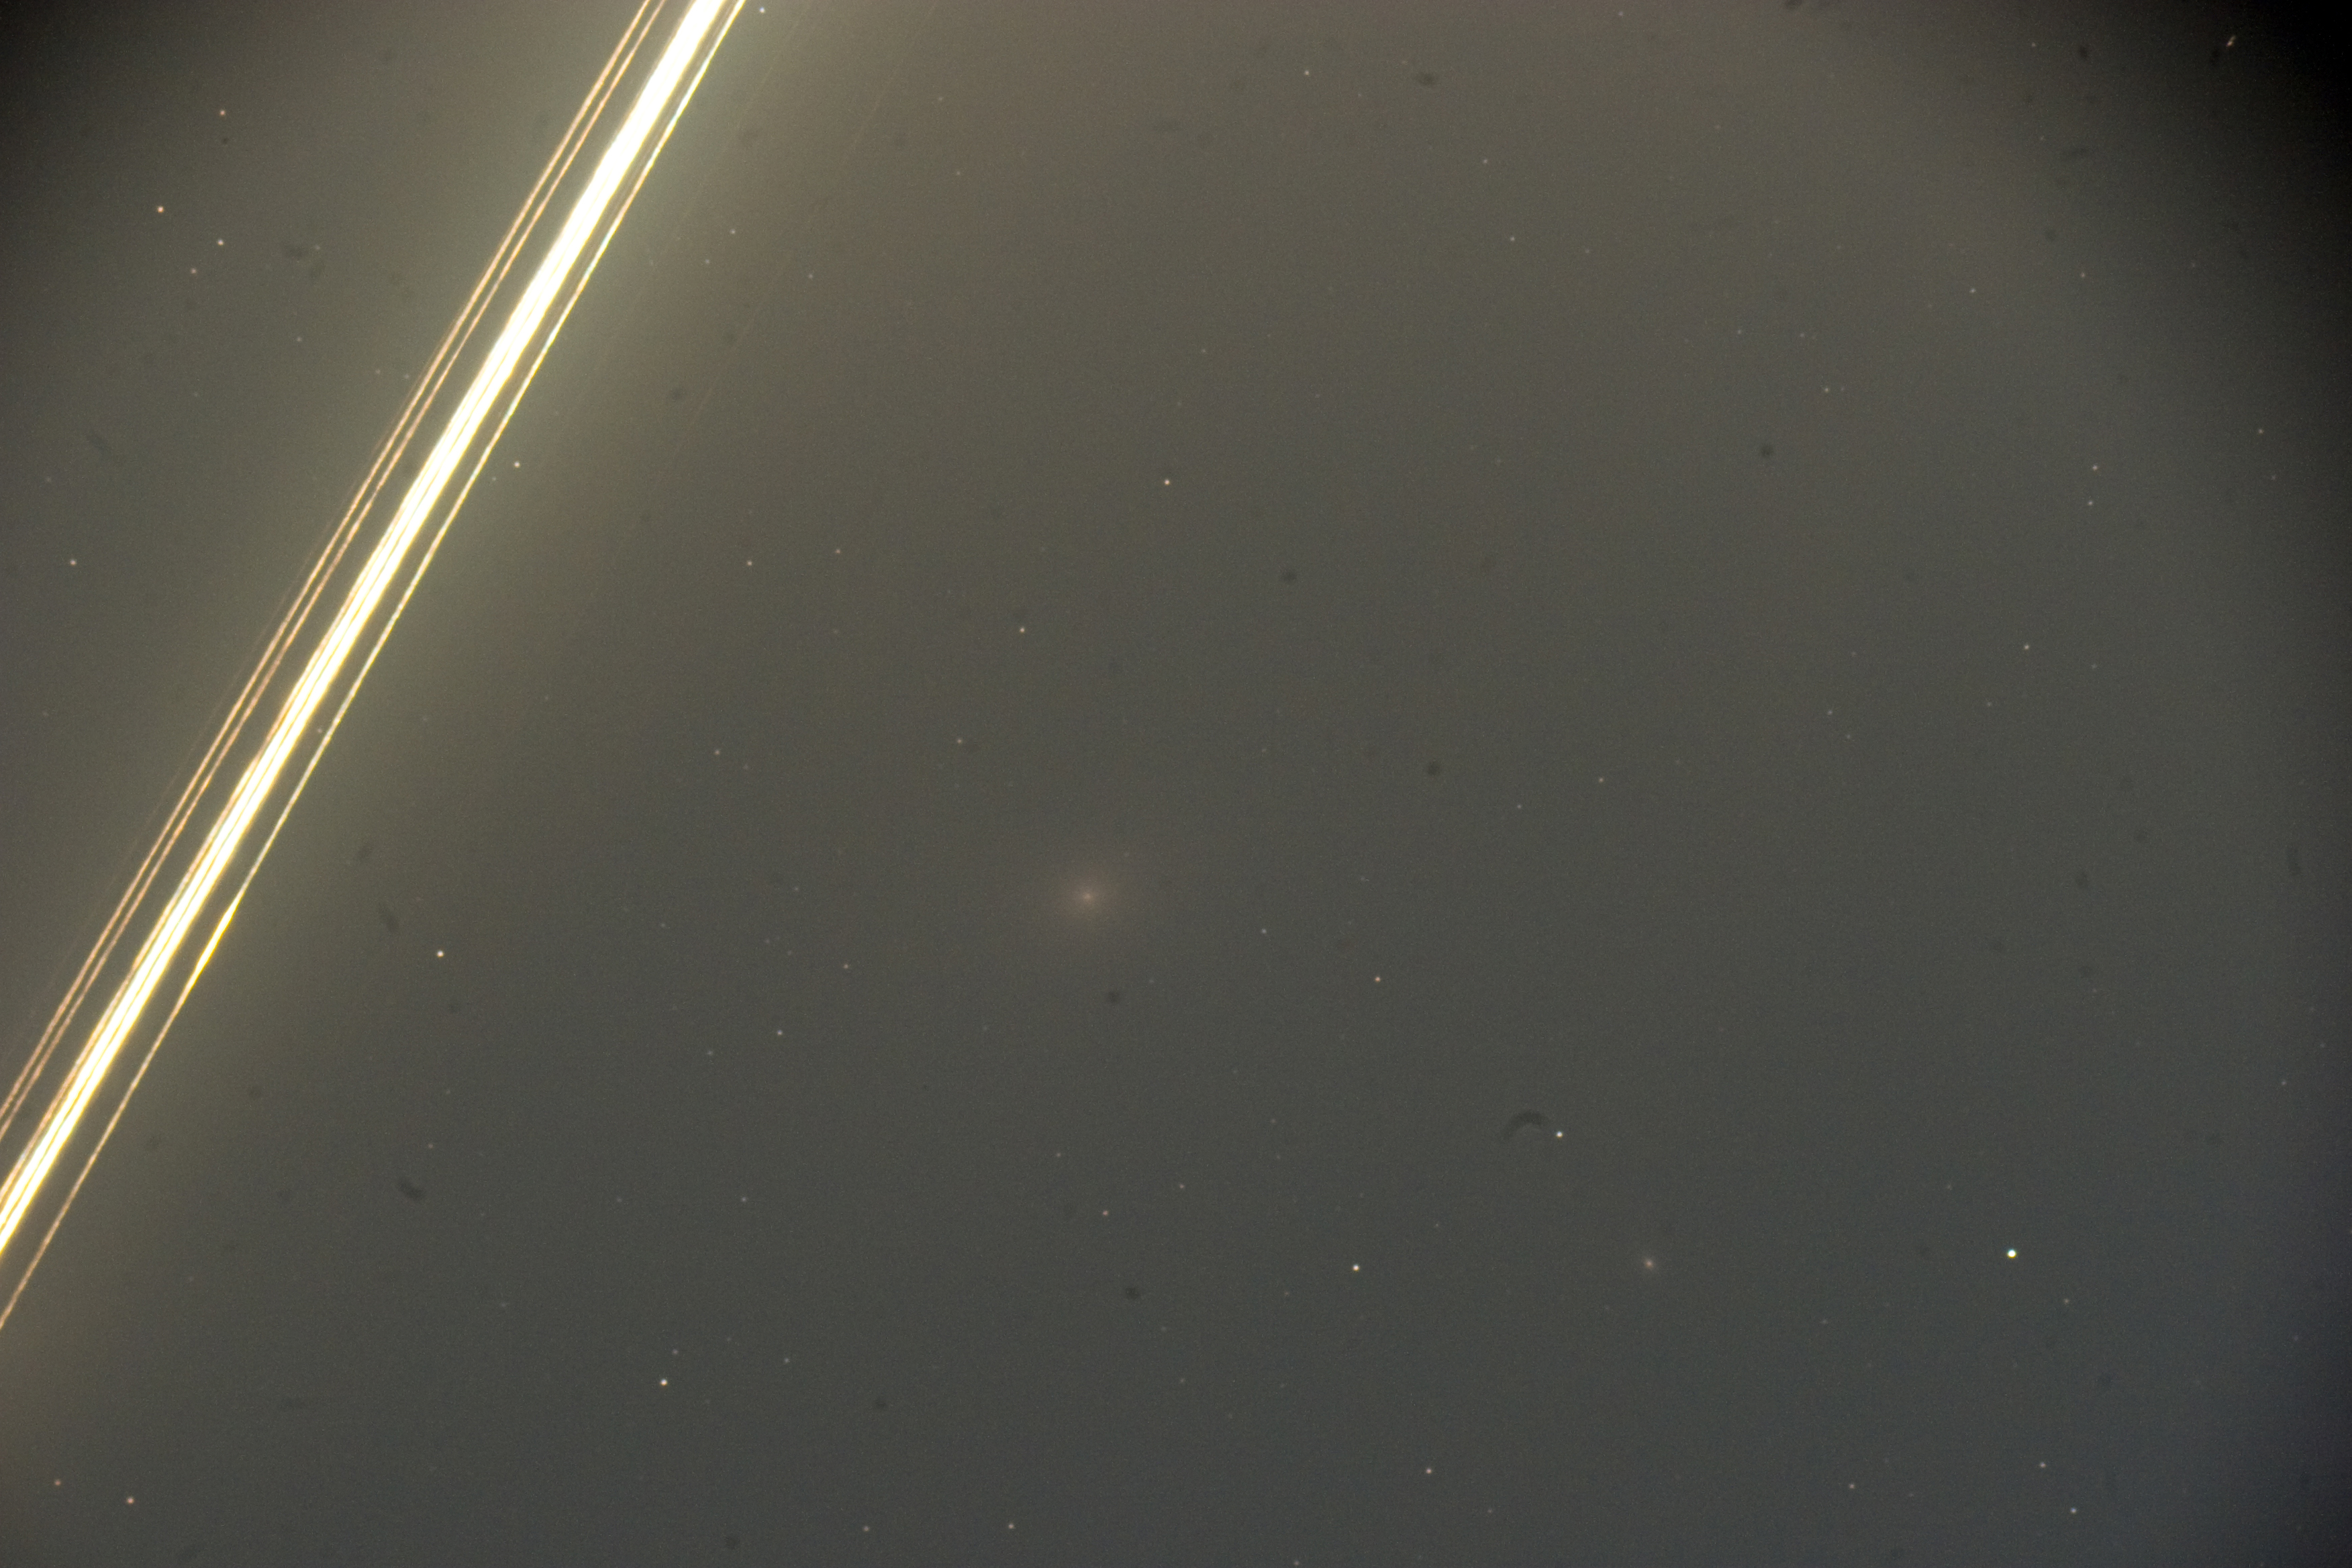
Below is the telescope photo showing several fragments in their final mili-seconds of the meteor’s flight. This is the first photo of its kind and the only telescopic photo of a super bolide in existence (CLAIM). Click the thumbnail below for a larger image. A super hi-res version is also available.

Telescopic Photo of Super Bolide - July 6th, 2009
By complete random chance or the grace of God, I was lucky enough to serendipitously capture a telescopic astrophoto of the bolide in its final stage; literally milliseconds before all light was extinguished and dark flight began. This act could never have been planned or purposefully executed for a multitude of reasons: 1) the appearance of such a large fireball itself is rare, happening only a few times over the globe each year 2) the event lasted less than 5 seconds and there was no way to anticipate the time or place where the event would occur. This means all photographic equipment that would be used to capture the event would need to be setup, pointing in the right direction of the sky and shooting prior to the onset of the event. 3) The picture was taken through a telescope, which was magnifying an extremely small space in the overall sky. To be more precise, the telescope covered less than 1 degree of space in the sky and there are over 40,000 degrees in the night’s sky!

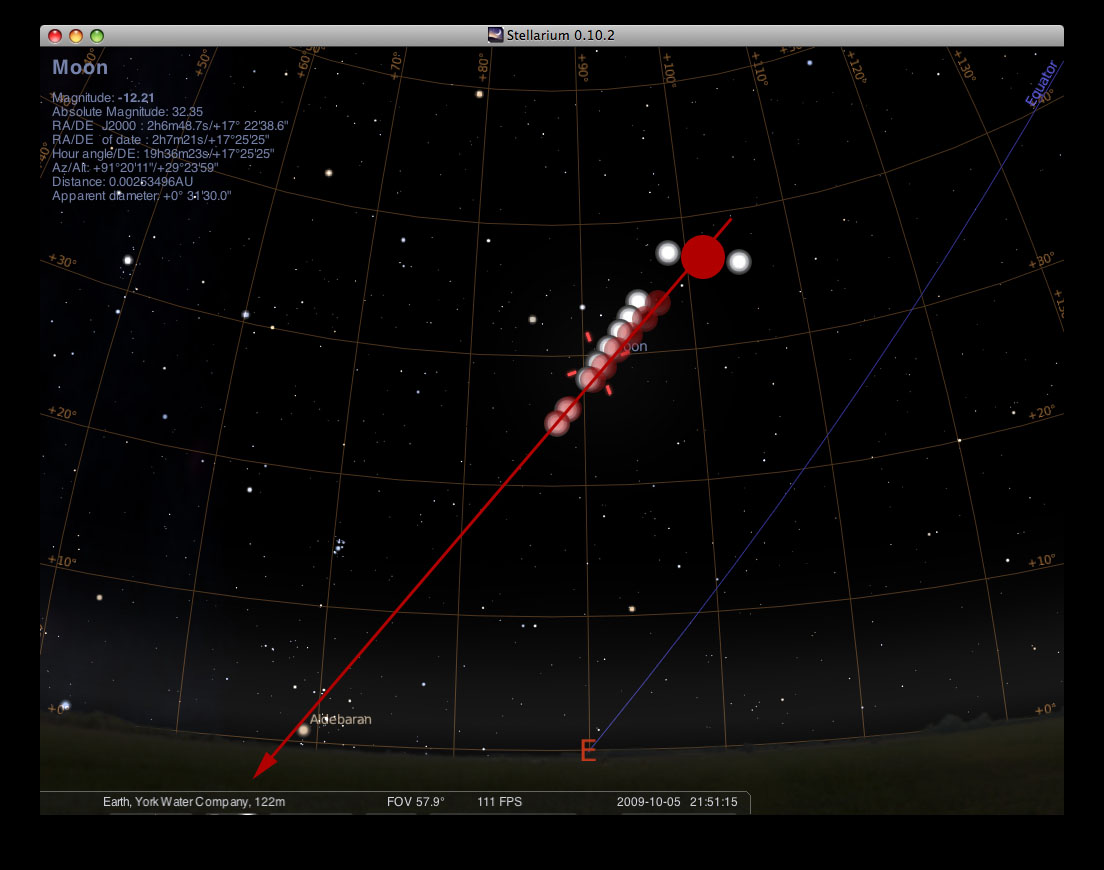
Skymap of Hankey Meteor Photo - July 6th, 2009
Regarding the circumstances of the picture, by hobby, I am an astrophotographer and at the time only 6 months new to the hobby. That night I was setting up and testing a new telescope and took photos of various objects including the moon and finally the Andromeda galaxy. The last job of the night was a series of five three minute long exposures through a DSLR camera attached to an Orion 80mm telescope. I started the job and then went inside for a quick break. During this time I heard and felt a rumble and my house shook. When I went outside shortly after this to tear down my equipment I briefly reviewed the pictures and noticed that the final picture in the series was considerably brighter on the screen but I had no idea what it was. It was not until the morning when I learned of the meteor that I re-examined the picture at full resolution and realized it was in fact the meteor.
Scientific Case For Authenticity of Telescopic Picture
Due to the extraordinary claims put forth by the picture it was immediately scrutinized and criticized by the scientific community. The critics claimed an airplane and not a meteor caused the streaks. Every experienced astronomer I have ever spoken too about the picture believes it is a plane at first glance. Only after careful inspection do they then realize, it is in fact the meteor. Most rational critics accept the meteor explanation for the picture after they have thoroughly examined the evidence, but a few outspoken critics remained. I put forth the following section as an effort to detail the scientific evidence I have used to conclude this is in fact a picture of a meteor. I hope this is enough to remove doubt from the few critics who remain, but I accept the fact that there will always be doubters. I also accept the fact that extraordinary claims require extraordinary evidence and that is what I present here in.
The following images are presented as evidence in the arguments that will follow.
1) The Before and After Photo
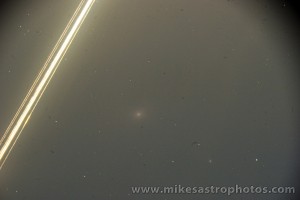
The two images below represent the last two pictures taken through my telescope on the morning of July 6th, 2009. The image on the left is a 3-minute exposure of the Andromeda Galaxy with no meteor present (note how dark the image is by comparision). The image on the right is the frame with the meteor. The intensity of the light in the image on the right is clear evidence this was an extremely bright object. The picture is almost washed out by the light of the terminal burst that ended just a few milliseconds before what was left of the meteor flew through the camera’s field of view.

Picture in series before meteor -- what the photo looked like without the presence of the meteor
The following images are the result of various photoshop filters applied to the original picture. With the filters subtle nuances in the original are made more apparent. Below each picture is a description of what the filter does, per the Adobe Photoshop documentation.

Equalize Filter

Inverted Filter

Posterize Filter

Equalize Filter

Inverted Filter

Posterize Filter

Threshold Filter
2) Equalize Filter
“The Equalize filter redistributes the brightness values of the pixels in an image so that they more evenly represent the entire range of brightness levels. When you apply this command, Photoshop Elements finds the brightest and darkest values in the composite image and remaps them so that the brightest value represents white and the darkest value represents black. Photoshop Elements then equalizes the brightness—that is, distributes the intermediate pixel values—evenly throughout the grayscale.”
Conclusions from Equalize Filter: Light from a plane would not be this bright and un-even. With the equalize filter applied it is clear that light from the terminal burst is captured in the image.
3) Invert Filter
“The Invert filter inverts the colors in an image. You might use this command to make a positive black-and-white image negative or to make a positive from a scanned black-and-white negative.”
Conclusions from the Invert Filter: When the image is inverted variations in pixel width and depth are more apparent. A plane’s beacon lights would be more constant and not vary in width and brightness intensity.
4) Posterize Filter
“The Posterize filter lets you specify the number of tonal levels (or brightness values) for each channel in an image and then maps pixels to the closest matching level. For example, choosing two tonal levels in an RGB image gives six colors, two for red, two for green, and two for blue.“
Conclusions from Posterize Filter: What is most obvious in the posterized image is the un-evenness in brightness especially near the bolide’s track. The bolide obviously looses brightness as it makes its way from the top of the picture to the bottom.
5) Threshold Filter
“The Threshold filter converts grayscale or color images into high-contrast, black-and-white images. You can specify a certain level as a threshold. All pixels lighter than the threshold are converted to white; and all pixels darker are converted to black. The Threshold command is useful for determining the lightest and darkest areas of an image.”
Conclusions from the Threshold Filter: The threshold filter clearly demonstrates the object imaged has very irregular brightness and that the brightness is dimming from the beginning of the picture to the end. Light from a plane would not leave such an irregular pattern.
Arguments Supporting the Meteor Explanation for the Hankey Photo
1) Time and Place
The meteor fall time as documented by a federal government regulated time stamp was 1:04:45. The time stamp from the Hankey picture was 12:06, which means the exposure ran from 12:03 – 12:06 camera time. The camera’s clock was not updated for day light savings time and this is why it was 1 hour behind. Compensating for day light time the two events occurred within the same three-minute window of time. Multiple videos place the extinction point of the meteor to the north east of Freeland MD. The camera and telescope as proven by the image of the Andromeda Galaxy was pointed to the northeast just 27º above the horizon. The time and place of the meteor picture and the meteor event are exact matches.
2) Non-Parallel Lines with Diverging Paths
Critics of the picture believe the object imaged is an airplane similar to this example and not the final stage of a fireball. While this is the most common first reaction to the picture, critics fail to recognize two critical points:
1) The image represents less than 1º of space in the sky
2) the telescope is pointed only 27º off the ground.
Due to the confined space of the picture and the distance above the horizon, the flight path required by a plane to make such a set of non parallel lines would exceed what is physically possible for any airplane — the entry angle required for such an effect would exceed what an airplane is capable of. In addition, nearly every streak in the picture is heading in a slightly different direction — some light paths move away from each other while others move toward each other – others curve and arc in opposing directions and still others burn out inside the picture. The streaks in this picture are far too irregular to be an airplane.
Examine the following image and note the difference in location of the various light streaks. The right side of the image captures the beginning of the bolide and it moves towards the left side. The total width variance from right to left is 20%. A 20% variation in width in less than 1º of sky space for a plane is physically impossible.

Non Parallel Lines with Diverging Paths
3) Evidence of Fragmentation and Other Abnormalities
The picture contains at least 10 unique streaks of light of varying width and intensity — as the objects move through the picture they get brighter and dimmer and wider and narrower. Some streaks loose brightness as they progress in distance to the point they have gone dark half way through the picture. Other bands of light break apart from each other and head off in separate directions. The following annotated image catalogs ten visible fragments and eight flight abnormalities that are telescopic evidence of both meteorite fragmentation and dark flight.

Meteor Fragments and Flight Abnormalities
The following is a list of flight abnormalities which suggest meteorite origins and document the fragmentation and dark flight of a meteorite.
4) Mathematical proof corroborated with video evidence – Altitude triangulation of york water video and Hankey Picture

Fireball Altitude Triangulation Example
A fireball in the sky makes a right triangle with the ground directly below it and each observer who witnesses it. Once the trajectory is established, as a ‘proof’, we can calculate the altitude at any point along the ground track using the Pythagorean Theorem, if we know two values: 1) the elevation angle of that point relative to the observer and 2) the distance from the observer to the point on the ground track.
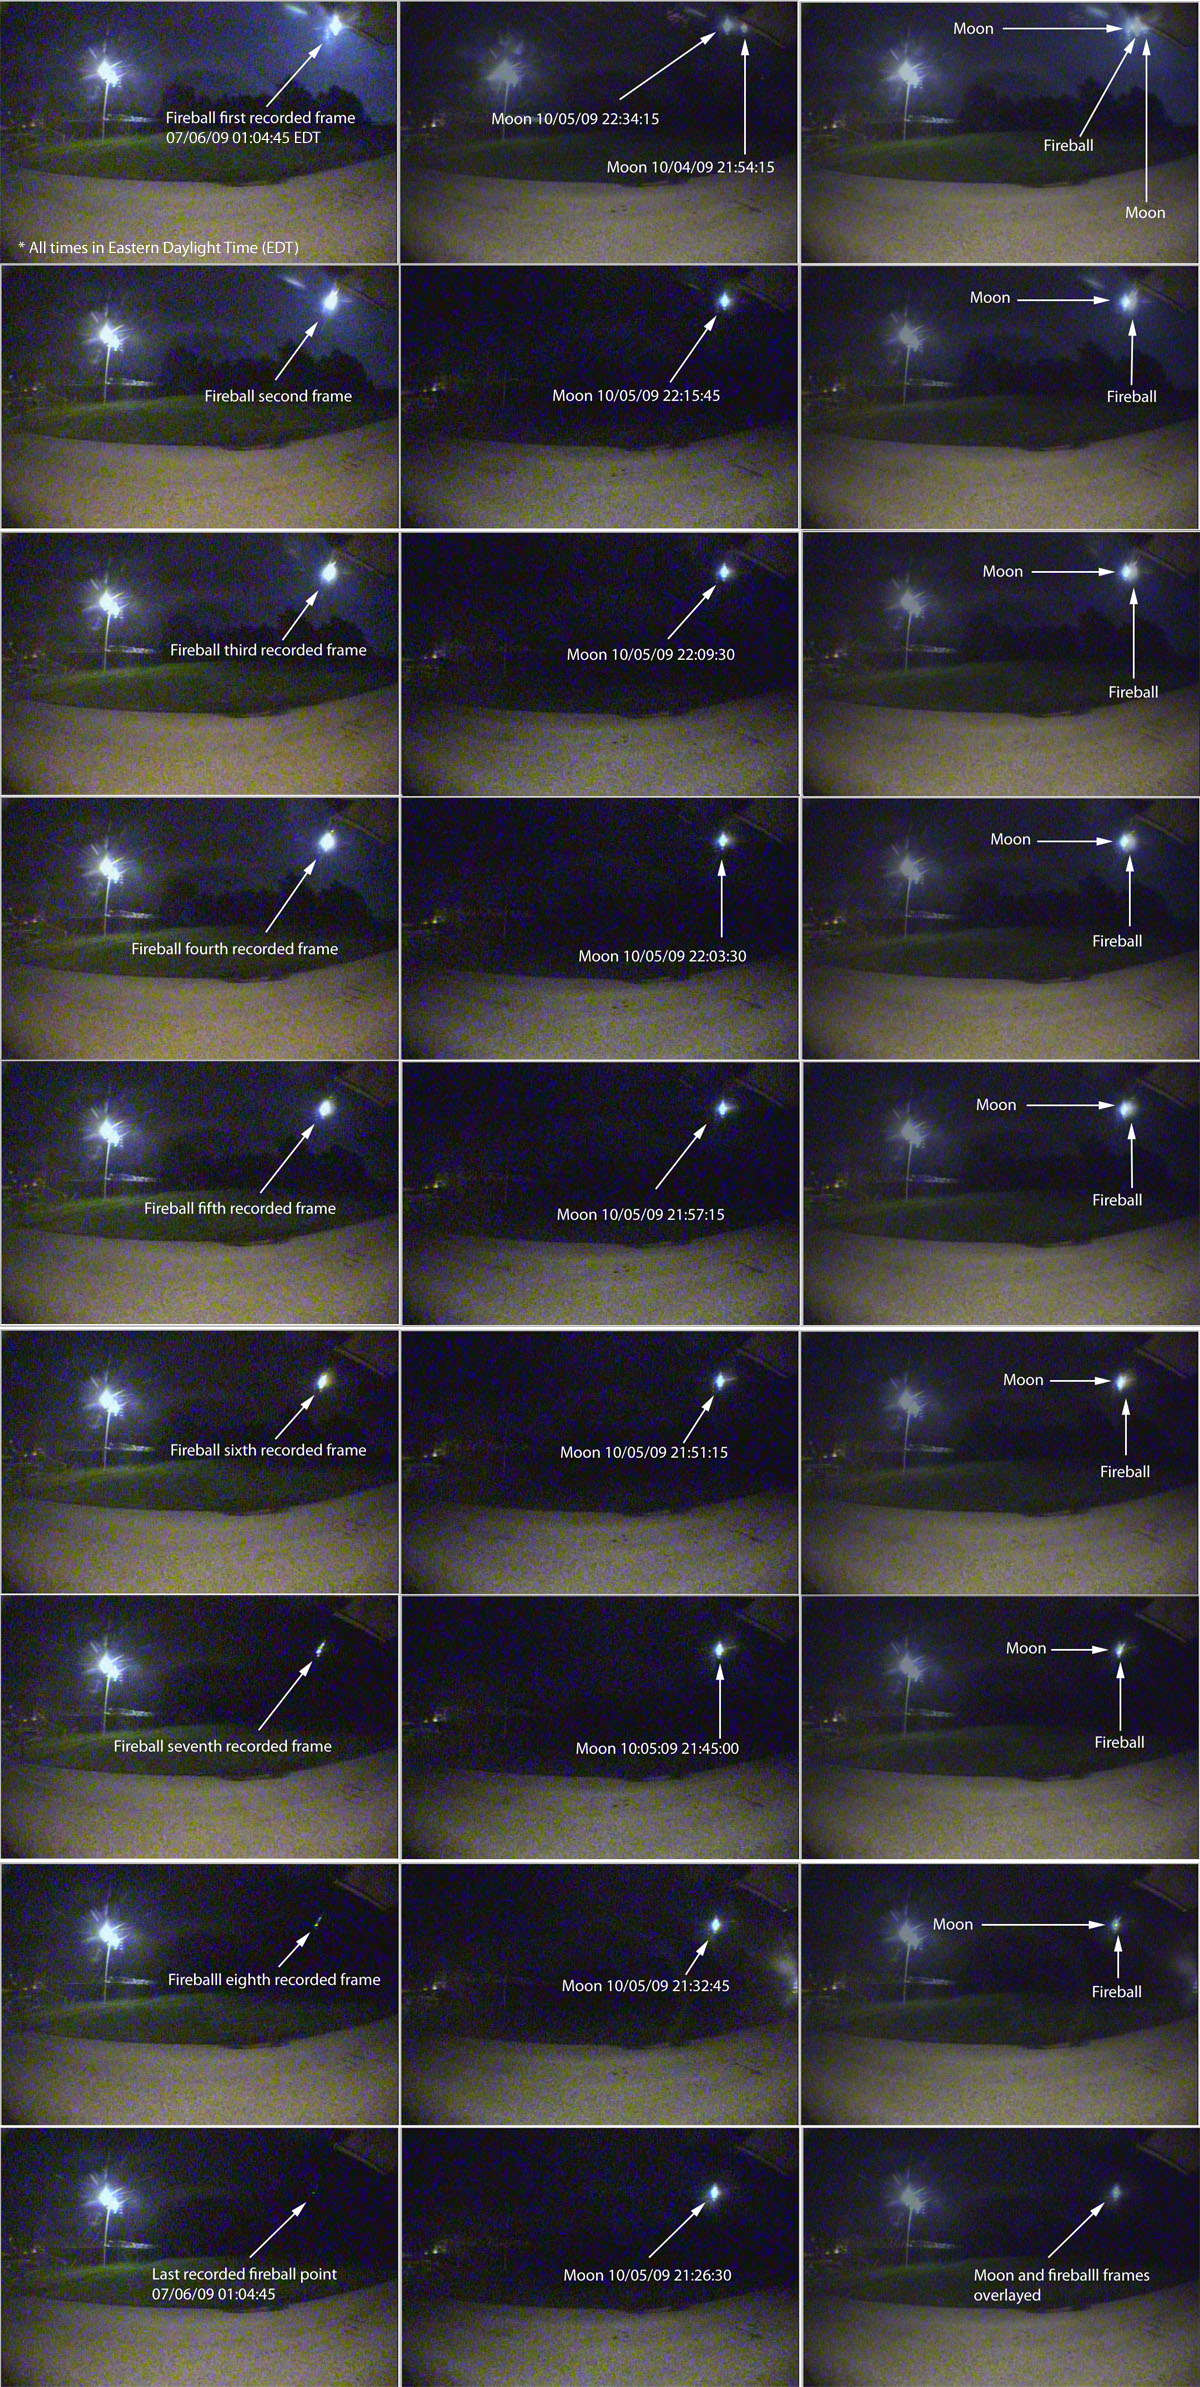
The York Water video was calibrated using video footage of the full moon rising in the camera’s field of view over a period of two nights in October 2009. The moon’s path in this footage favored the right hand side of the camera’s field of view — the same side that recorded the meteor. Because the camera was in a stationary enclosure and had not moved since the meteor, the moon footage provided precise azimuth and altitude reference points that could be used to calibrate the original meteor video. To accomplish the calibration, we extracted 9 frames from the meteor video. In each frame, at the very least, part of the meteor overlapped with the moon’s location at one time or another. Referring to the moon’s position in the sky at the date and time of the calibration and its position relative to the meteor, we are able to determine the azimuth and elevation of the meteor in 9 key frames of the York Water video.
In frame #7, the York Water video captured the near exact moment the Hankey picture was taken and this can be proven mathematically.

York Water Calibration Frame #7 - The Hankey Frame
Using the observer’s elevation angles, the ground distances to the modeled track and the Pythagorean theorem we can solve for the altitude for each observer. We will find that the altitude at this common point shared by both photographic records matches within a margin of 200 meters.
Examining a map of the ground track and azimuth angles we can pinpoint the intersection point of the two videos.

Map of York and Hankey Altitude Triangulation
The following map pinpoints the intersection point of frame #7 from the York Water video and the end-point of the Hankey picture.

- Intersection Point of York Water Video Frame #7 and Hankey Picture

Variables Needed to Calculate Altitude at Intersection Point
Intersection Point #1
York Frame #6 Elevation Angle at Intersecting Frame = 29.4º
Distance from York Water Camera to Intersection Point = 45.61 km
Calculated Altitude = 25.7 KM
Hankey Point 1 Elevation Angle = 27.3667º
Distance from York Water Camera to Intersection Point = 47.47 km
Calculated Altitude = 25.49 km
Difference in Altitude Calculations = 25.7km – 25.49km = 0.21 km
Intersection Point #2
York Elevation Angle at Intersecting Frame = 28.23º
Distance from York Water Camera to Intersection Point = 46.14 km
Calculated Altitude = 24.77 km
Hankey Point 2 Elevation Angle = 26.6333º
Distance from York Water Camera to Intersection Point = 48.32 km
Calculated Altitude = 24.23 km
Difference in Altitude Calculations = 24.77 km – 24.23km = 0.54
You can make all of these calculations yourself to confirm values using this right angle calculator.
While we accept a slight margin of error due to manual measurements and possible time-drift on the York camera the night of the moon footage (+/- 1 minute), the calculations presented mathematically prove within a very small margin that the same moment in time and space is shared between both the York video and the Hankey picture.
Conclusion: These measurements and calculations prove that the York Water video and the Hankey image document the exact time and geographic place when and where the meteor occurred. Ignoring all other apparent evidence that the Hankey image is in fact a picture of the meteor, this mathematical fact [the triangulation of altitude] is in disputable.
5) Cohesion with trajectory multiple solutions based on videos and witness reports
As demonstrated in the previous section, the meteor’s location in time and space relative to the trajectory is a match, further proving from a common sense standpoint that the Hankey picture is the fireball. BUT what if we calculated trajectory models using data sets that do not include the Hankey image. Would we get similar trajectory models?
Over 20 witness interviews were performed on site and from those interviews at least 12 resulted in useable azimuth and altitude measurements taken using GPSs compasses and inclinometers. When mathematically solving the trajectory with a 2 observer plane geometry intersection solution we do find multiple alternative trajectory models that are all very similar to the rigorous oblate earth solutions Rob Matson computed for York / Hankey and York / Kruse.
The following video shows the flat earth 3d solution for the Hankey / York track (in red) and multiple witness based 3d trajectory solutions (in green) that do not use the Hankey picture or the York video evidence. This illustrates the point that solving for a solution with alternative data produces very similar results. This is especially apparent in the meteor’s entry angle as this is nearly identical in most solutions. The final end point for all solutions is also very similar in most cases. Raw data that can be used to perform these model calculations is provided below.
6) Professional Opinions
Rob Matson:
“Aircraft lights are *absolutely* ruled out due to the divergence of the trails toward the bottom of the image. Critics ~should~ know this. I can only assume that they have not examined the image closely enough and mistakenly think the trails are parallel.”
Regarding the ionized column:
“The missing piece of information refuting this argument is the meteoroid fragments’ altitude at the time they are passing through your field of view. If critics stating this argument knew that altitude was only 20km, I imagine they would drop the objection about the lack of ionization column glow in your image.”The other factor critics aren’t taking into consideration is that the exact time of the fall is within the 3-minute exposure of your telescope, and your scope was pointed in the general direction of the fall. Occam’s Razor suggests that it is rather unlikely that you would happen to image a crashing aircraft (the only way for the light trails to diverge) in the same part of the sky within +/- 90 seconds of the meteor fall. The simplest explanation is that it’s the meteor.
Kelly Beaty Sky and Telescope
When I first saw Mike’s image, my first impression was, “hmm, must have been after fragmentation, because look at all those pieces!” too many to be plane lights, IMHO. also, as I’ve plotted the photo against a star chart to determine scale, etc, I can tell you that the orientation of the streak set is entirely consistent with the generally west-to-east track derived from the York video.
Moreover, the set of streaks is only 0.06 degree wide. that’s a small angle! geometrically correcting for the photo’s azimuth of 62 degrees, if those streaks are lights on a plane at 40,000 feet they’d span only 48 feet. to be on the wingtips of even a midsize airliner (~100 feet), it’d have to have been impossibly higher up.
The other thing that caught my attention (besides the vignetting) was the general glow around the set of trails. this halo is consistent with optical scatter from a very bright source (perhaps on slightly dew-covered optics; remember, it was 1 a.m.) and *not* consistent with the relatively dim lights from an airplane.
Richard Kowalski
I’m convinced. You have an image of the fireball! Congrats. Great catch!
What I wanted to see was the variation in the brightness of the trails at full resolution, both in pixels and bit depth.
Thanks again for allowing me to examine your original data. I very much appreciate that!
Witness Reports
Over the course of this fireball investigation over 20 witnesses have been interviewed in person and a full fireball interview has been performed. In at least 12 cases useable azimuth and altitude measurements have been obtained. Below is a map of interviewed witnesses and BOOM reports for the Mason Dixon Meteor.

Interviewed Witnesses and Boom Reports
While data gathered from witness accounts is notoriously flawed, the witness interviews provided an immense value with regard to corroborating the track derived from the video and photographic evidence. In fact the strategic placement of numerous witnesses at different places along the meteors path established boundaries for the track. Witness observations especially on the southern end of the track confine the possibilities for variation of the track.

Witnesses on South Side of Track Confine Possibilities
On the northern side of the track three witness observations further confine the track and pinpoint the terminus location, just a bit north of the York Water burnout line.

Witnesses Northern Side of Track
The following map illustrates how the simplest azimuth directions (north, south, west, east) from witnesses in the RIGHT locations can be extremely valuable in validating the ground track of a meteor. These observations create confining boundaries for track possibilities. Having observers close to the track at both the beginning and the end of the event limits total possibilities for variance or error.

Key Witnesses Corroborating Camera Based Solutions
Trajectory Information
Video, Photographic and Witness Observational Data
| Observer Name |
Latitude | Longitude | Azimuth Sta | Elevation Start | Azimuth End | Elevation End |
| York Water | 39.91966 | -76.74741 | 101.50833 | 36.13333 | 87.59083 | 24.73638 |
| Telescope Picture | 39.676883 | -76.679617 | 56.91667 | 27.3667 | 56.51667 | 26.6333 |
| Kruse | 40.537653 | -79.832703 | 112.21138 | 14.5297 | 105.0675 | 6.14972 |
| Baum | 39.528011 | -76.400444 | 205 | 65 | 5 | 30 |
| 3 Sisters | 39.97436 | -76.14127 | 220 | 50 | 250 | 48 |
| Craig | 39.93658 | -76.16192 | 220 | 78 | 327 | 56 |
| David | 40.335386 | -76.4248 | 177 | 25 | 163 | 25 |
| Emmanuel | 39.925325 | -76.1238 | 232 | 19 | 275 | 22 |
| Levi & Barbara | 39.9064 | -76.069742 | 220 | 65 | 260 | 60 |
| Eli King | 39.819806 | -76.2811 | 215 | 19 | 195 | 10 |
| Ronks Road | 40.017189 | -76.1652 | 210 | 20 | 190 | 55 |
| Amos Fisher | 39.970531 | -76.181 | 274 | 85 | 222 | 45 |
| Liz And Ben | 39.801139 | -76.3514 | 242 | 32 | 187 | 19.1 |
Scientific Details Regarding Fall
Below is a table containing values for data elements relating to this fall.
| Scientific Details Regarding July 6th, 2009 PA Fireball | |
| Fall Details | PA 7/6/09 |
| Date Time | 07/06/11 5:04:45 UTC |
| Start Point | 39°16’49.80″N 76°36’57.49″W |
| End Point | 39°56’12.33″N 76°11’59.40″W |
| Meteor Start Altitude | 90 KM |
| Meteor End Altitude | 20-25KM |
| Entry Angle | 39 degrees |
| Heading | 25.51 degrees |
| Length of ground track | 81.16 KM |
| Initial Velocity | 11 km/sec |
| Terminal Velocity | 6 km/sec |
| Estimated Entry Mass | 172 KG – 800 KG |
| Magnitude | -24 |
| Average Wind Speed | 29 – 39 knots 100º east |
Rigorous Oblate Earth 3d Trajectory Models
Rob Matson, an aerospace engineer by day and leading meteor scientist by night, analyzed and extracted measurements from the useable videos on two different occasions — an initial run immediately after the fall and then a follow up run several months after we had a chance to improve the raw data. In the case of the Kruse video, Alison was able to send us a HD version of the video. By stacking and manipulating the video frames we were able to identify more stars in the picture. The slight changes in altitude and azimuth from the improved video caused the geometric impact point of the track to shift 5 km to the northeast. After calibrating the York Water video Rob ran another model using York Water and the telescope picture. This model was almost identical to the Kruse / Hankey video. In Rob’s words
This track is *extremely* similar to the solution I computed using the Pittsburgh video instead of the York Water data above. About the only real difference is that track is rotated a few degrees clockwise in bearing relative to the old solution, and it’s a slightly shallower entry angle. All in all, this is very encouraging: two triangulation solutions giving in essence the same answer.
Here is a map that illustrates both trajectory models. The darker red line on the right is the Kruse/Hankey solution and the lighter red line on the left is the York Water/Hankey solution.

Meteor Trajectory Models

Meteor Trajectory Models
York Water / Hankey Model
Below are the coordinates computed by Rob Matson for the rigorous oblate 3D trajectory solution using the York Water video and Hankey picture.
Latitude Longitude Alt
——— ———- —–
39.18580 -76.67532 100.0
39.28050 -76.61597 90.0
39.37567 -76.55615 80.0
39.47131 -76.49584 70.0
39.56744 -76.43505 60.0
39.66405 -76.37376 50.0
39.76115 -76.31196 40.0
39.85875 -76.24965 30.0
39.95684 -76.18683 20.0
40.00608 -76.15522 15.0
40.05544 -76.12347 10.0
40.10493 -76.09160 5.0
40.15454 -76.05959 0.0
Kruse / Hankey Model
Below are the coordinates computed by Rob Matson for the rigorous oblate 3D trajectory solution using the Kruse video and Hankey picture.
Latitude Longitude Alt (km)
——– ——— ——–
39.27349 -76.56202 100
39.35968 -76.51355 90
39.44626 -76.46472 80
39.53325 -76.41553 70
39.62064 -76.36597 60
39.70844 -76.31605 50
39.79665 -76.26575 40
39.88527 -76.21508 30
39.97432 -76.16401 20
40.06378 -76.11256 10
40.15368 -76.06072 0
Multi-Model Calculations
Through the course of this investigation I have learned how to plot and triangulate fireballs. Recently using a series of posts made by Rob Matson on the Fireball Working Group, I was able to programmatically solve a fireball trajectory using data values from 2 observations and a set of formulas in an excel spread sheet. I translated the XLS to a perl script and set it up to recursively compute a solution for every combination of observers. In the case of this fall we had 12 total observers and this resulted in 66 solutions.
Here’s a google earth video that shows all of the 3D solutions plotted at the same time. It is a bit messy, but interesting that while there are a wide variety of possible solutions, most are quite similar and they all seem to terminate in the same place.
Dark Flight Models
Over the course of this investigation multiple dark flight models have been calculated to estimate the location where meteorites may have fallen. While a trajectory solution is relatively straight forward, the dark flight model is much more complicated. There are many forces that effect a meteorite’s flight path after it has ‘burned out’ still 20km high in the sky. Among these factors are final velocity, drag, gravity, wind and others. By the time the meteorites hit the ground, they could be miles away from their original flight track. Finding a dozen to a hundred small rock fragments in an area 1-2 miles wide and 10-20 miles long can prove extremely difficult, even when you know you are inside the right location. For these reasons, I
Matson, Fries, Spurny

Mason Dixon Meteor Strewnfield Estimates
Hunting and Community Outreach Progress

Mason Dixon Meteor Strewnfield Estimates

Landowners Contacted in the Strewnfields
GPS Tracks
Questions that Remain Unanswered
Can the orbit be plotted with available video and data?
Can light curve be constructed from available videos?
How big was the meteoroid when it entered, how much would have ablated? How much material should be left? Could it have burned up completely?
How many pieces are there? Should we be looking for dozens to hundreds of little ones or only a handful of big ones?
Can each fragment be plotted separately?
Can the mass of each fragment be determined?
-
Welcome to Mike's Astro Photos!
Thanks for dropping by! Feel free to join the discussion by leaving comments, and if you want to stay updated bookmark the site, subscribe to the RSS feed, or like us on facebook.
If you think you've found a meteorite, want to go meteorite hunting have a question about astronomy, meteors, meteorites or just want to say hi, please send email to mike.hankey [AT] gmail.com
-
Mason Dixon Meteor Picture
Best Posts
Here are some of our best photos.
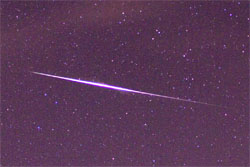
Quandrantids Fireball - 2011
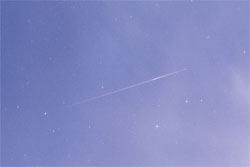
Persied Fireballs - 2011
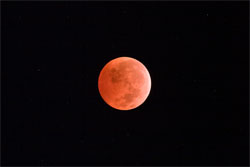
Lunar Eclipse - 2010
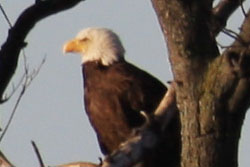
American Eagle - 2010